Central Limit Theorem, for the win!

These days, we see a lot of memes and short videos on social media in the style of: “I survived another day without using the Pythagorean theorem!”.

Well, this is not one of those…
This is actually a story about one of the unsung heroes of the world of statistics – the Central Limit Theorem (CLT).
This theorem is like the reliable backbone of statistical analysis, making sense of the chaos in our data-filled world. It’s what allows us to use simple averages (means) to understand complex datasets, and that’s a big deal! Whether we are talking medical studies, market research, or even astronomical observations, the CLT is the quiet powerhouse making sure we can draw reliable conclusions from all that data.
So, what is CLT? Our friend, ChatGPT, says: “The Central Limit Theorem is a fundamental principle in probability theory and statistics. It states that when an adequately large number of samples are taken from any population with a finite level of variance, the mean of all samples will be approximately equal to the mean of the original population. More importantly, the theorem tells us that these sample means will tend to follow a normal distribution (commonly known as a bell curve), regardless of the shape of the population distribution. This convergence to a normal distribution occurs as the sample size becomes larger, making the CLT particularly powerful for predictions and statistical inference, as it allows for the approximation of the sampling distribution of almost any statistic using a normal distribution, provided the sample size is sufficiently large.”
Wow, sounds nice, but it means nothing to most people. Until an actual use case presents itself. Here comes one 😊!
A while back, Inspira Group’s IT job board HelloWorld started searching for an appropriate way to inform their users about salaries corresponding to different positions, taking into account seniority, location, and even exact companies. The data was being collected for a significant amount of time and initially it was presented in a form of a (min, mean, max) triple.
While the triple contained valuable information for the website users, it didn’t provide insight into how representative a particular sample was to the entire population.
CLT, in practice, works for samples of 30 or more datapoints. In the HelloWorld’s case, this means that if there are at least 30 known salaries for a specific combination of the elements considered (position, seniority, location, company), then a relevant conclusion about the mean salary of all the people (well, in Serbia 😊) who correspond to the same position, seniority, location and company can be drawn, even though not all of their salaries are known. This works the same way if one or more of the four elements are omitted, for example if we are analyzing a sample based only on position and location.
Anyway, what is the relevant conclusion that can be drawn about the mean salary of the entire population?
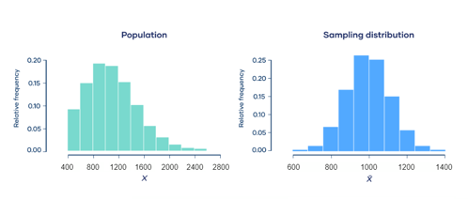
For example, let’s consider all the Software Developers in Belgrade. What our friend (ChatGPT) was telling us is that no matter what the distribution of their salaries looks like (the green histogram in the image below), if we took a bunch of samples larger than 30 and calculated the mean salaries for all the samples, those means would form a normal distribution (the blue histogram in the image below).
However, we only have one sample (the group of Software Developers in Belgrade that have shared information about their salaries on the HelloWorld website), and hopefully it is larger than 30. How does CLT help with it? It is in fact really simple when it comes to implementation. What we can learn based on the mean salary of the sample we have is the range of values in which we can say with high certainty that the mean salary of the entire population (the population consisting of all the Software Developers in Belgrade) lies. Depending on the level of certainty we want, we can use one of the following three formulas:
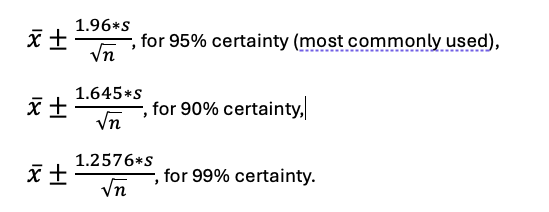
Here, x is the mean salary of the sample, s is the standard deviation calculated for the sample, and n is the size of the sample.
And that is it! That is the whole wisdom. If we have a large enough sample, we calculate it’s mean, and based on the formulas above, we can say where the true mean of the population probably lies.
The data about mean salaries obtained with the help of CLT will soon be available on the HelloWorld website. There is, of course, much more to this story, for example the details about the process of cleaning and transforming the data, handling the factor of time when a certain datapoint occurred, security and so on, but that type of storytelling has a more of an intimate café vibe 😊.
For more information and a fantastic explanation of CLT, check out the StatQuest YouTube channel.
Author
Stevan Ostrogonac, Senior AI Engineer at Inspira Group